Creating a Graphical Dashboard
You can create a graphical dashboard to monitor a Cardano stake pool that you operate using the following open source software solutions:
- Prometheus collects time-series data—metrics—from applications and infrastructure using a pull model, facilitating continuous system monitoring as well as alerting.
- Prometheus Node Exporter enables exporting system hardware and operating system metrics for a host computer using Prometheus. Additionally, enabling a textfile collector allows you to export any custom metrics that you may generate.
- Grafana is an observability platform that facilitates visualizing data Prometheus collects.
Figure 1 provides a network diagram illustrating how Prometheus and Grafana components may connect and interact in a configuration involving multiple computers, such as when monitoring a Cardano stake pool. The diagram includes default port numbers.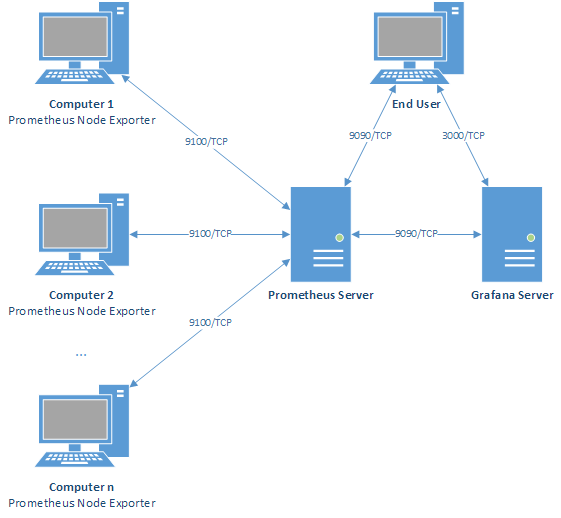
To allow Prometheus and Grafana components to communicate, you must open required ports to specific computers using respective firewalls.
To monitor a Cardano stake pool configuration, you may install the Prometheus and Grafana servers on the same relay node along with Prometheus Node Exporter, for example. Configure Prometheus to scrape each instance of Prometheus Node Exporter, as well as each Cardano Node Prometheus endpoint. For more details, see Figure 2.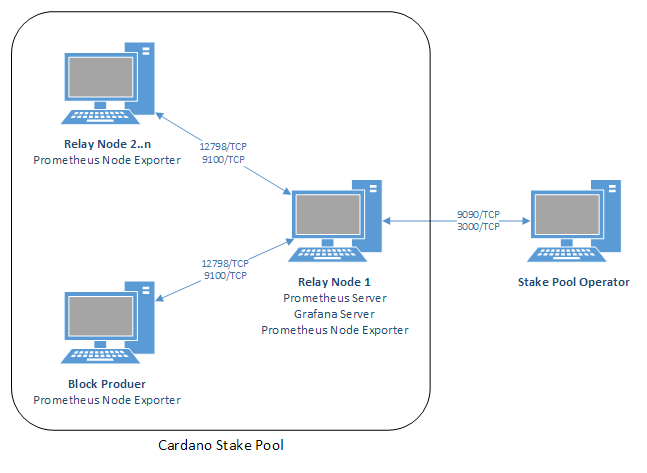
Note | For details on using the Cardano Node Prometheus endpoint, see Monitoring Metrics. The following procedure assumes that Cardano Node Prometheus endpoints in your stake pool configuration listen on the default port 12798. If you change the port number, then update the procedure accordingly. |
To connect to the Prometheus and Grafana servers securely as an end user, consider Using Port Forwarding.
Installing and Configuring Prometheus
To install and configure Prometheus to monitor a Cardano stake pool:
- On the computer that you designate to host the Prometheus server, type the following commands using a terminal window:sudo apt-get update -ysudo apt-get upgrade -ysudo apt-get install prometheussudo systemctl start prometheus.servicesudo systemctl enable prometheus.servicesudo systemctl status prometheus.service
- Using a text editor, open the
config*.jsonfile for the Cardano Node instance, and then edit the following key to set the IP address where the local Cardano Node Prometheus endpoint listens:"hasPrometheus": ["0.0.0.0",12798]Note

When a server binds to
0.0.0.0, the server listens on every IP address assigned to the computer. - Save and close the
config*.jsonfile. - To restart the local Cardano Node instance, type:sudo systemctl restart cardano-node.service
- To verify that Prometheus endpoint metrics for the local Cardano Node instance are available, using a Web browser navigate to http://localhost:12798/metrics
OR Using a terminal window, type:curl -s http://localhost:12798/metrics - To install Prometheus Node Exporter, type:sudo apt-get install prometheus-node-exportersudo systemctl start prometheus-node-exporter.servicesudo systemctl enable prometheus-node-exporter.servicesudo systemctl status prometheus-node-exporter.service
- On the computer where you installed Prometheus Node Exporter in step 6, in the firewall open ports 12798 and 9100 to incoming traffic. If you use UFW, then follow the commands to open a port in Configuring Uncomplicated Firewall updating the port numbers as needed.
Important

On the computer hosting the Prometheus server, opening ports 12798 and 9100 is NOT needed.
- Repeat steps 2 to 7 on each computer in your stake pool configuration.
- To configure Prometheus scrape targets:
- On the computer where you installed Prometheus in step 1, using a terminal window type:cd /etc/prometheussudo cp ./prometheus.yml ./prometheus.baksudo nano ./prometheus.yml
- In the
prometheus.ymlfile, add an entry in thescrape_configssection for each Cardano Node instance and Prometheus Node Exporter instance in your stake pool configuration, using the following example as a template where<BlockProducingNodeIPAddress>is the IP address of the block-producing node in your stake pool configuration:global:scrape_interval: 15s # By default, scrape targets every 15 seconds....# A scrape configuration containing exactly one endpoint to scrape:# Here it's Prometheus itself.scrape_configs:# The job name is added as a label job=<job_name> to any timeseries scraped from this config.- job_name: 'stakepool'static_configs:- targets: ['localhost:12798']labels:alias: 'Relay 1'type: 'cardano-node'- targets: ['localhost:9100']labels:alias: 'Relay 1'type: 'prometheus-node-exporter'- targets: ['<BlockProducingNodeIPAddress>:12798']labels:alias: 'Block Producer'type: 'cardano-node'- targets: ['<BlockProducingNodeIPAddress>:9100']labels:alias: 'Block Producer'type: 'prometheus-node-exporter'Note
For more details on configuring Prometheus, see Configuration.
- Save and close the
prometheus.ymlfile. - To restart Prometheus, type:sudo systemctl restart prometheus.service
- On the computer where you installed Prometheus in step 1, using a terminal window type:
- To verify that Prometheus is scraping the desired targets:
- Using a Web browser on the computer where you installed Prometheus in step 1, navigate to http://localhost:9090
- In the Prometheus Web user interface that displays, click the drop-down arrow next to the Status item in the top navigation bar, and then click Targets
- Confirm that each target you configured in step 9 lists as an Endpoint, and that the value in the State field for each target is UP
- In Prometheus, storing and querying data is achieved using PromQL (Prometheus Query Language). To execute a basic PromQL query, in the Prometheus Web user interface click Graph, then click the drop-down arrow next to the Insert Metric at Cursor field, then in the list of metrics click the metric that you want to query, and then click the Execute button.
In query results, time-series data for metrics display on the Graph tab. Current values for metrics display on the Console tab.
If a PromQL query does not filter targets and data satisfying the query are available for multiple targets, then query results include the data from all applicable targets.
Note | In PromQL, filter queries using curly braces ( |
Enabling a Textfile Collector
To enable a Prometheus Node Exporter textfile collector:
- To create a folder for the textfile collector to parse, using a terminal window on a computer having Prometheus Node Exporter installed, type:sudo mkdir /var/lib/prometheus/node-exporter/textfile-collector
- To configure Prometheus Node Exporter to parse the folder that you created in step 1, type:cd /lib/systemd/systemsudo cp prometheus-node-exporter.service prometheus-node-exporter.service.baksudo nano prometheus-node-exporter.service
- In the
prometheus-node-exporter.servicefile, edit the following line:ExecStart=/usr/bin/prometheus-node-exporter --collector.textfile --collector.textfile.directory=/var/lib/prometheus/node-exporter/textfile-collector $ARGS - Save and close the
prometheus-node-exporter.servicefile. - To restart Prometheus Node Exporter, type:sudo systemctl daemon-reloadsudo systemctl restart prometheus-node-exporter.service
- To verify that Prometheus Node Exporter parses the folder that you created for the textfile collector, type the following command, and then ensure that no error messages associated with the textfile collector appear in the log file:journalctl -fu prometheus-node-exporter.service
- Repeat steps 1 to 6 on all computers in your stake pool configuration having Prometheus Node Exporter installed.
Using a Textfile Collector
The following procedure provides an example showing you how to use a Prometheus Node Exporter textfile collector to export—expose—any custom metrics that you may choose to generate.
Prometheus Node Exporter parses all files in the directory specified as the textfile collector directory having a PROM file name extension. In PROM files, expose data using text-based Exposition Formats.
To export custom metrics using a textfile collector:
- On a computer hosting Cardano Node as well as Prometheus Node Exporter, to retrieve the value of the
$NODE_HOMEenvironment variable, using a terminal window type:echo $NODE_HOME - Using a text editor, create a file named
$NODE_HOME/exportMetrics.shand then add the following lines, where<NodeHomeValue>is the value of the$NODE_HOMEenvironment variable that you retrieved in step 1, to create a Bash script that exports the size of the directory on the local computer containing Cardano blockchain ledger data assigned to a metric namedcardano_db_size:#!/bin/bash# Assign the directory that the Prometheus Node Exporter textfile collector parses to a variabletextfileCollectorPath="/var/lib/prometheus/node-exporter/textfile-collector"# Assign the size of the local directory containing Cardano blockchain ledger data to a variabledbSize=$(du -s <NodeHomeValue>/db | cut -d $'\t' -f 1)# Using the format <MetricName> <Value> export to a temporary file the size of the local directory containing Cardano blockchain ledger dataecho "cardano_db_size ${dbSize}" > ${textfileCollectorPath}/exportMetrics.tmp# To avoid partial scrapes, write metrics to files atomically using a temporary file, and then rename the filemv ${textfileCollectorPath}/exportMetrics.tmp ${textfileCollectorPath}/exportMetrics.prom - To set execute permissions for the
exportMetrics.shscript, type:chmod +x $NODE_HOME/exportMetrics.sh - To run the
exportMetrics.shscript, type:sudo $NODE_HOME/exportMetrics.sh - To verify that the custom metric named
cardano_db_sizeexports successfully, using a Web browser press CTRL+F5 to perform a hard refresh of the Prometheus Web user interface, and then query the metric.
Challenge | Create a cron job that regularly schedules running a script that exports custom metrics using a textfile collector. The cron job requires root privileges. To create a cron job that runs using root privileges, type: |

Installing and Configuring Grafana
To install Grafana:
- On the computer that you designate to host the Grafana server, type the following commands using a terminal window:# Install prerequisite packagessudo apt-get install -y apt-transport-https wget# Import the GPG keysudo mkdir -p /etc/apt/keyrings/wget -q -O - https://apt.grafana.com/gpg.key | gpg --dearmor | sudo tee /etc/apt/keyrings/grafana.gpg > /dev/null# Add the repository for stable releasesecho "deb [arch=amd64 signed-by=/etc/apt/keyrings/grafana.gpg] https://apt.grafana.com stable main" | sudo tee -a /etc/apt/sources.list.d/grafana.list# Update the list of available packagessudo apt-get update# Install open source Grafana softwaresudo apt-get install grafana# Configure Grafana to start when the computer startssudo systemctl daemon-reloadsudo systemctl enable grafana-server.service# Start Grafanasudo systemctl start grafana-server.service# Verify that Grafana is runningsudo systemctl status grafana-server.service
- Using a Web browser on the computer hosting Grafana, navigate to http://localhost:3000
Note
If you are Using Port Forwarding, then adjust the URL accordingly.
- On the Grafana Log In page, type admin in the Email or Username field, then type admin in the Password field, and then click the Log In button.
- When prompted, change the password.
To add your Prometheus server as a data source in Grafana:
- On the Grafana Home page, click Connections in the left pane, and then click the Add a New Connection button in the right pane.
- In the Search field, type Prometheus, and then click the Prometheus plugin in the Data Sources area.
- In the top right corner of the Web page, click the Add New Data Source button.
- In the Name field, type Prometheus
- In the Connection area, type http://localhost:9090 in the Prometheus Server URL field.
- Scroll down to the bottom of the Web page, and then click the Save & Test button.
If the test is successful, then Grafana displays the message Successfully Queried the Prometheus API.
Creating a Dashboard Using Grafana
To create a graphical dashboard for monitoring a Cardano stake pool:
- On the computer hosting the Grafana server, download the example Grafana Dashboard file.
- On the Grafana Home page, click Dashboards in the left pane, then click the dropdown arrow next to the New button in the top right corner of the right pane, and then click Import
- Drag and drop the file named GrafanaDashboard.json that you downloaded in step 1 in the Upload Dashboard JSON File area on the Import Dashboard page.
- Click the Change UID button, and then clear the contents of the Unique Identifier (UID) field, and then click the Import (Overwrite) button.
Figure 3 shows the example Grafana dashboard that you downloaded in the previous procedure.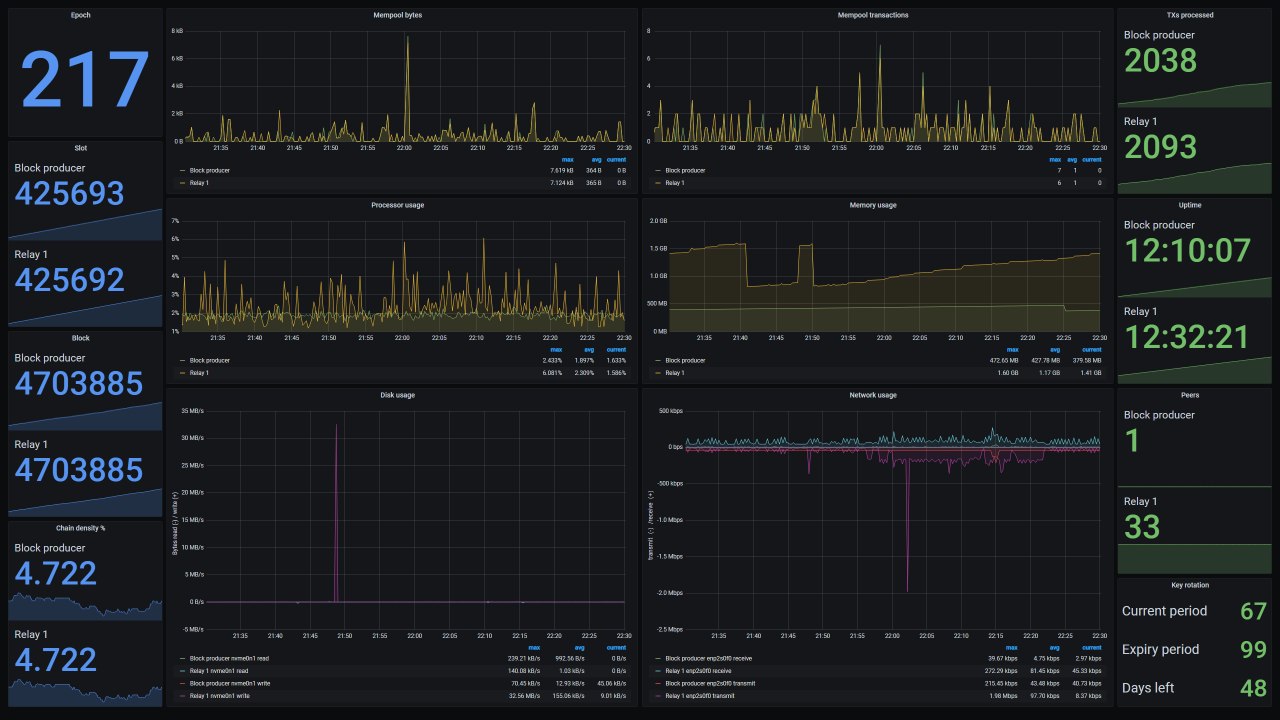
You can edit the appearance and PromQL queries retrieving data for panels that a Grafana dashboard displays.
To edit a Grafana dashboard panel:
- When viewing a dashboard, click and drag the sizing handle in the bottom right corner of a panel to resize the panel.
- To edit a panel, click the three-dot menu in the top right corner of the panel, and then click Edit
- On the Queries tab, edit PromQL queries as needed.
Important
To troubleshoot data that a Grafana dashboard panel displays, test PromQL queries using the Prometheus Web user interface.
- In the Visualization pane, edit the appearance of the panel as needed.
- To save revisions to a dashboard, click the Save Dashboard button in the top right corner of the Web page, then type a description of your edits in the Message field, and then click the Save button.
Additional Resources
For more details on creating Grafana dashboards, see the topic Visualize Data.
To explore some additional third-party Grafana dashboards available in the Cardano community, see Appendix D: Community Projects.